July – The Fed, Breadth, & Liquidity
Breadth and liquidity go hand in hand. In this report, we revisit Thursday, what led up to it, and what it might mean going forward. However, first we are compelled to share this really interesting fact about Thursday. According to @bespokeinvest, there was only one other day since 1979 where the Russell 2000 rose 3%+ while the S&P 500 was down, and that was in October 2008. We saw many reports stating that Thursday was the biggest divergence between the Russell 2000 and the S&P 500 in several years, but that doesn’t interest us as much as needing to go back to 2008 to find a similar trading day. October 2008 was still at the height of the financial crisis. Lehman had failed. Investment banks were converting into banks, and D.C. was voting (almost daily) on measures to support the financial system and the economy. Corporate bond issuance ground to a halt. CDS auction mechanics became a dinner time topic. Things were in disarray then and the fact that we need to go back that far to find a similar day is eerie. Thursday started quite “normally.” Academy helped breakdown the CPI numbers live on Yahoo Finance. The bond market was responding “appropriately” to what was very good inflation data (not just the headlines, but also the details). Maybe the initial muted reaction by stocks should have been a warning sign of what was to come, but it wasn’t obvious that we were in for the sort of day that has only happened once in 45 years! It should have been a “ho-hum” sort of day, but instead a rotation trade started, and given both liquidity (and we’d argue the concentration effect in “passive” strategies), it became unstoppable.
The records will show that on the week the Nasdaq Composite index finished up 0.25% (the Nasdaq 100 finished down 0.3%) and the Rusell 2000 charged ahead by 6%, but the story is bigger, more interesting, and more dangerous than that!
If Only There Was An August FOMC Meeting
Markets are pricing in 1 cut by the end of the September meeting (95% likely that it happens at that meeting). As laid out last week, we believe that The Path to Cuts is clear and necessary. While July still seems unlikely, there are more economists and Fed watchers calling for that date. We have been adamant that not only does the data warrant a July cut, but also that it would be easier on the Fed (in terms of getting dragged into election social media) if they go ahead in July.
While it remains unlikely, there are a few things worth considering as we approach that meeting:
- CPI was good. Housing was less of a problem, but it still overstates the actual rent increases occurring now because of how it is calculated. Apparently, this is something that Congress will have to address, since CPI is the basis for COLA adjustments in Social Security.
- Several components, based on annualizing the last 3 months, are actually deflationary. While it is great to see prices come down (as opposed to seeing the rate of change slow down), that might be something the Fed wants to watch. Beyond that, many components, again, based on annualizing the last 3 months, are below the 2% stated target. The internals point to even more progress on inflation than the already good headline numbers indicate.
- We get PCE on Friday July 26th, ahead of the meeting. This is the Fed’s preferred measure of inflation. Core PCE expectations for the annual rate are set at 2.6% according to Bloomberg. While looking back over 12 months is somewhat useful, it is often overly influenced by data no longer reflective of the current trend. With the monthly estimate of 0.2% we could claim 2.4% annualized, but our preferred method is to take 3-month data and annualize it. With May having come in at 0.08% and April at 0.26%, we could possibly see 0.5% for 3 months, annualizing to 2% – mission accomplished 😊. Okay, that is a bit of a stretch, but is it? Look for expectations to move lower as economists update their models. Let’s also not forget that PCE Deflation has spent much of its adult life below 2% (see the PCE Nothingburger from March).
- PPI. Sure, PPI came in a touch high, but PPI ranks pretty much near the bottom of the barrel in terms of predicting future inflation. In theory, it should, but we’ve seen very little work demonstrating that what makes sense on paper turns out to work in the real world. More interesting is that we’ve seen some work indicating that the portions of PPI that flow into PCE were quite good, increasing the odds that PCE will be “surprisingly” good.
- Inflation expectation. While the CONsumer CONfidence survey also ranks low in terms of predictive value, the FOMC does like to know about inflation expectations. Both the 1-year and 10-year readings came in below 3% for the first time since March. While still a touch high, they are moving back in the right direction for the Fed. This supports a September cut more than a July one, but it does help us along the path to cuts.
The one thing that concerns me more than anything else about inflation is the increased risk of some sort of Geopolitical Event occurring while so many in the U.S. seem focused on our election, rather than on what is going on around the globe (see registration link to our upcoming Geopolitical and Macro Strategy Webinar on July 17th at 11am ET).
Breadth, Liquidity, and Narratives
Until Thursday afternoon, the only narrative that I heard on bonds was:
- Lower yields are great for mega caps!
We’ve argued, from time to time, that this “correlation” seems to come and go. That there are times when it seems to hold true, and others when it doesn’t. But that has always been more in the context of the “bad news is good” versus the “bad news is bad” argument.
Yet, by Thursday afternoon, apparently it was “obvious” that rate cuts should spur a rotation into small caps?
- According to Bloomberg, by the close on Thursday, the market was pricing in 0.995 cuts by the end of the September meeting (91% likely to occur at the September meeting with only an 8.5% chance of a July cut). That did move from the 0.78 cuts at the close on Wednesday, and 0.825 cuts that were priced in at the end of last week. That hardly seems like enough to trigger a move at the magnitude of what we saw on Thursday. Also, let’s not forget that the move didn’t occur in the futures market, or really at the open.
It is always nice to have a narrative, but I’m pretty sure that not a lot of bingo cards had a 3% increase in the Rusell 2000 and a loss of almost 1% in the S&P 500 on a “medium-sized” beat of the data.
That sort of outsized move concerns me. While breadth, or lack thereof, has been a major concern of ours, it is unclear if it is “healthy” to reverse all of that in 2 days.
Being brutally honest, who didn’t think (or fear, in the case of the bears) that as the Nasdaq 100 climbed 314 points as we neared 2pm, it would retrace all of Thursday’s losses? While keeping the small cap gains? In the end, it dropped almost 200 points from there, mostly in the last half hour of trading. Yet another sign, from our seat, of abysmal liquidity.
So, we start next week having experienced some incredibly unusual divergences and clear signs that liquidity, in either direction, is lacking.
The Near Impossibility of Equal Weight Indices
The S&P 500 has a total market cap of $49 trillion as of Friday. The Dow Jones U.S. Total Stock Market index is at $57 trillion (by value, the S&P 500 covers about 86% of the U.S. stock market).
S&P 500 vs S&P Equal Weight: 2018 – 2019
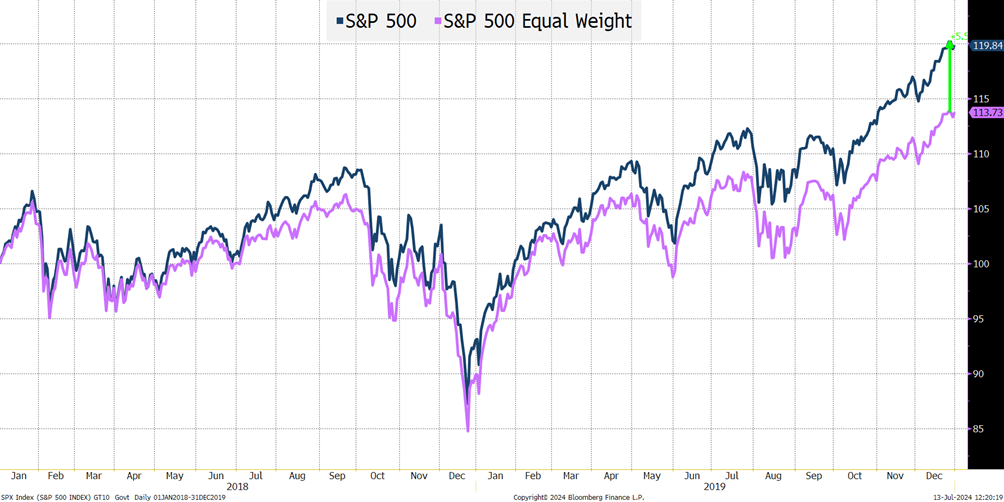
Over this 2-year period, the overall index outperformed the equal weighted index by 5.5%.
S&P 500 vs S&P Equal Weight: 2020 – March 2023
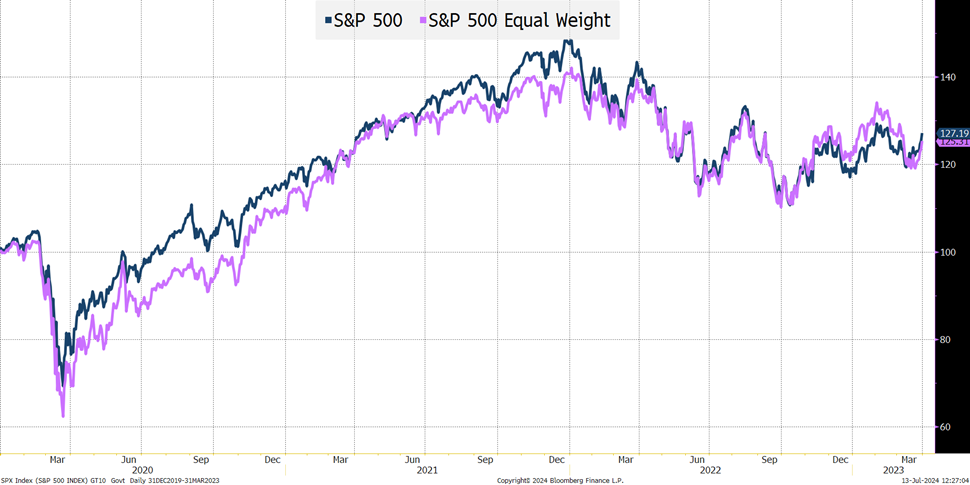
During the more than 3 years tracked in the chart, which included COVID, ZIRP, and the meteoric rise and fall of ARKK, we saw some deviations between the 2 indices, but typically under 10%. Again, remember we had so many “one-off events” to digest like oil futures trading negative, that it seems difficult to believe that they tracked each other so closely. Yet, they did and finished this more than 3-year period with a performance difference of less than 2%.
In theory why shouldn’t 500 stocks, representing over 85% of the entire U.S. stock market, perform similarly regardless of whether they are equal weighted, or market cap weighted? Probably the main reason why hardly anyone ever talked about the equal weighted indices was because they didn’t behave that much differently.
S&P 500 vs S&P Equal Weight: March 2023 – Present
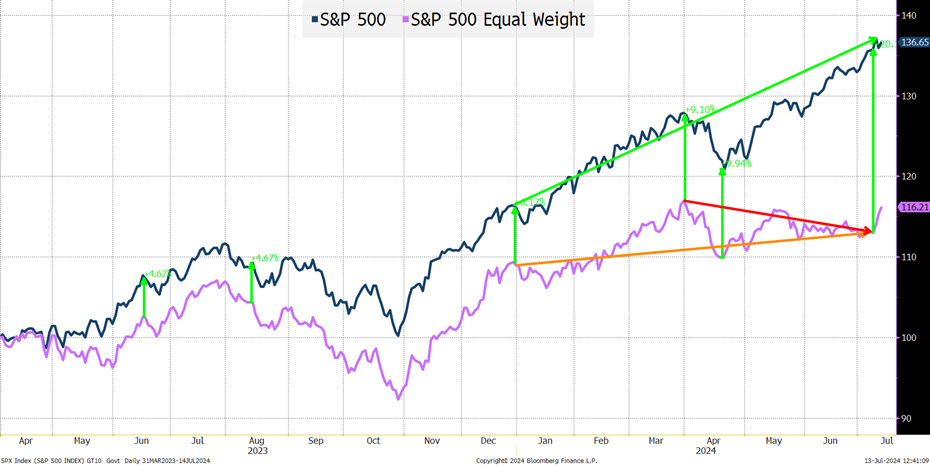
We start seeing a divergence shortly after the “official” launch of ChatGPT and “generative AI capabilities” in early 2023 (a version was released in November 2022, but it didn’t seem to resonate as much then).
Possibly another factor is that the 2nd to last rate hike occurred in May 2023, with the last hike occurring in July 2023. The divergence, though, stayed relatively stable until this year. From the middle of 2023 until the start of this year, it was somewhat “stable” at around 6%. Yes, we had an initial deviation, but it grew gradually. That is not the case now. It went to 9% by the end of March and stood at a whopping 20% as of Wednesday of last week. The equal weight index is actually down from March 27th. Again, that seems almost difficult to do and I think it is far more important than any relationship between the S&P 500 (or Nasdaq) and the Russell 2000.
Market Weight Index= ∑ Market Weight/Total Market Cap*Stock Return
Equal Weight Index= ∑ Stock Return/500
When comparing different indices, we have different returns to apply to most stocks since there is only a limited overlap.
The same stocks create a 17.7% return year-to-date when using market weights, and only a 6.7% return when using an equal weight.
It is a bit like seeing a team with a record setting .500 batting average, that is losing most games. Two people are hitting almost a thousand and no one else is able to bat them in, because everyone else is hitting below the Mendoza line!
The top 12 companies (13 holdings) currently account for almost 40% of the market cap index. Those stocks are up an average of 42%.
The average return of the other 490 or so companies is 5%.
The average return, year-to-date (ignoring dividends), of the smallest 250 companies in the S&P 500 is 0%!
In many ways, it is almost staggering how this measure of the U.S. stock market is really now just captive to a handful of companies (from a return perspective).
That has been great as the momentum has continued, but as we saw on Thursday, and even late Friday afternoon, that can easily be a double-edged sword.
New Money versus “Recycled” Money
On Thursday, it looked like investors (or at least one large investor in an illiquid market) sold big caps to buy small caps.
On Friday, at least for a little while, all stocks were going up. Presumably, this was the “money on the sidelines” argument, where investors have been waiting to shift money from bonds (money market funds) into equities. But that trade faded across the board. Not enough to cast complete doubt on the money on the sidelines argument, but enough to make us wonder.
Do investors need to sell one stock to buy another stock, or can they shift from some other asset class into stocks?
That is the biggest question as we enter this week.
For now, at least, liquidity seems low enough that on a percentage basis, we can see the “laggards” do well even if the winners are going down. The market cap of the laggards is so small relative to that of the year-to-date gainers, that the buying pressure can create very nice pops in the small caps.
Bottom Line
Watch for signs that momentum (including the mega caps) is rolling over. Thursday, and even late Friday, had many of the hallmarks of “quant fund” selling. We have seen time and again in these markets (including Treasuries) the ability of quants to overrun liquidity. No one ever cares or complains when quants are buying what they are buying (since it makes the prices go up), but it is scary when it goes the other way (like quants helping to push 10-year yields to 5% last autumn). These are crowded trades with lots of positions based on technicals, there are lots of “it can’t go down” calls, and presumably there is leverage (there is always leverage).
Base case is outperformance of small caps, value, and anyone “left behind,” but in a down market, and one fraught with the risk of a sizable one day move!
Rates. Even with rate cut bets increasing, we should see steeper (and less inverted) curves. Watching 10s closely as they broke through some resistance on Friday, but not enough to change our expected range of 4.3% to 4.5%. We are nervous (for the first time since we set this range) that we are too high, but we are sticking to our guns there for now.
Credit should be good but watch for some weakness if banks report significant loan loss reserves or any additional signals that consumer credit is as stretched as many fear.
July illiquidity, quants, paradigm shifts, geopolitical risks, and a Fed caught between a rock (lower inflation and a slackening labor market) and a hard place (memories of transitory and the 1970s) may make this a summer where vacations are spent focused on markets rather than enjoying yourself! Hopefully not, but it is shaping up in a way that risks that had been below the waterline are being exposed.
In terms of lack of breadth, beware of what you wish for, as getting an expansion of breadth may come with far more costs than the “money on the sidelines” crowd bargained for!