Building the Case for Rate Cuts
A month ago we published our Updated Rate Outlook. As we start turning our attention to the Fed announcement on July 31st, we wanted to reiterate our view (I still think that there will be 2 to 3 cuts this year, for a total of 75 bps), and update some other thoughts given recent events. 2s and 10s are more in our year-end range than our end of summer range, and other yields are a touch lower than expected (but given recent volatility, that could change in a day).
Using the Bloomberg WIRP (World Interest Rate Probability) function, we see the market has moved a touch in our direction on Fed probabilities.

Basically, 75 bps by the end of January 2025, which I expect to be pulled forward.
No Cut in July?
We have argued, quite aggressively, that the Fed should make their first cut in July.
Partly, because the economic data supports it (more on that in a minute), but it also takes the spotlight off of the Fed in the heat of the election.
Regardless of whatever else we have learned about this election in the past few weeks, it has confirmed our view that much of it will be fought on social media. We’ve also learned or confirmed (depending on your starting point) that there are very few topics that are “off-limits” in our current election cycle.
I physically wince at the thought of the first cut in September, stocks soaring 5%, and literally all hell breaking loose on social media as it is portrayed as helping the incumbents. It does not matter if that is true or not, social media is far more about “creating a good narrative and running with it” than with the truth. While I cannot confirm that there are more senior politicians discussing the Fed and talking about their mandate, or it is just a function of today’s media, but it seems like it.
The data could easily justify a July cut, and from a political standpoint, it makes sense, but there does seem to be a risk that after getting “transitory” quite wrong, they are going to be overly cautious on cutting.
The Data and the Trend in Data
On a standalone basis, the jobs report would not signal the need for a rate cut. Academy’s NFP Instant Reaction – Goldilocks or Not? highlighted many of the reasons why this report was even better for bonds than the headline suggested.
From a jobs standpoint, there is clear evidence that:
- The job market, particularly the private sector, is slowing.
- Increasingly, there is a belief that much of the “good” data has been overstated and will be revised down going forward.
- Finally, it seems like this time last year, we were getting headline after headline of union negotiations resulting in record-breaking deals. That does not seem to be the case anymore. It is now possible to enter local establishments and not see “Help Wanted” signs plastered over the doors and walls.
Since we are trying to develop better, faster, more reliable sources of data, we had to spend a few minutes looking at the online data. We are in the process of building a framework to track this more closely, but here are a few “interesting” anecdotes:
- The Conference Board published their June HWOL Report (Help Wanted Online) and concluded that as of the end of May, there had been a 10% decline in job postings.
- From May, the BBC’s Job Boards are still Rife with ‘Ghost Jobs’ is an interesting read and certainly fits my confirmation bias that many jobs listings are just fishing expeditions for good candidates (you never know who might apply), or are just easier to keep posted.
- I was somewhat surprised when ChatGPT returned with:
“There are indeed more job postings on Indeed.com now compared to last year. The hiring market has shown significant growth, with companies adapting to new hiring practices post-pandemic, such as remote work, flexible schedules, and virtual interviews. This shift has allowed businesses to attract a more diverse talent pool and meet the increased demand for new employees. Employers have added hundreds of thousands of jobs early in the year, reflecting a positive trend in job availability and market growth (Indeed).”
I was surprised enough by that answer, that of course I clicked the link, only to find ChatGPT referenced a report from October 2021 (probably user error on my part).
We are also starting to hear more about the Sahm Rule Recession Indicator. For long time T-Report readers, you know that I hate the use of “rules” around things that are conjectures, interesting theories, etc., but this “rule” will garner some discussion. The “rule” is that when the 3-month moving average for unemployment rises 0.5% above the minimum 3-month average in the past year, we are about to enter a recession.
One year ago, the 3-month moving average was 3.6% and today it is 4% (this month was 4.1%). The good news is that the moving average from a year ago continues to rise, giving some buffer, but clearly, we are in the “zone” for people to notice this risk. Since the chart above is from the St. Louis Fed it seems reasonable to believe that it comes up as a discussion topic. While a year ago, when inflation seemed rampant and there was a lot of confusion about the effectiveness of Fed policy (supply chain issues, etc.), it may have made sense to force the country into a recession to fight inflation. That would seem very much like “cutting off the nose to spite the face” at this point in time.
Speaking of Rules…
Ok, I’ve already admitted that I don’t like the term “rules” as they are applied in economics, but the devil can quote scripture for his own purpose, so let’s look at the Taylor Rule.
The Atlanta Fed Taylor Rule Calculator lets you estimate the Taylor “Rule” rate. Using three pre-filled scenarios, the calculation came up with estimates of 4.61%, 3.91%, and 3.79%. All of which are below today’s rate of 5.375%.
Again, definitely not a “rule” (and looking at some historic charts, I’m not sure why it maintains that label as the deviations between the so-called “rule” and actual policy are often quite large), but it likely comes up in the conversation about appropriate monetary policy.
Using ChatGPT I got the answer to the question of “using only the Taylor Rule, what should the fed funds rate be?”
“According to the Taylor Rule, the federal funds rate should be approximately -1.165%. This negative rate indicates that the current economic conditions might call for an expansionary monetary policy, but in practice, rates are usually adjusted to be positive.”
I can only assume that it meant to say it is 1.165% lower than the current fed funds rate, but who knows.
Inflation – Saving the Best for Last
Before diving into inflation, which warrants being the final section, at least in terms of how we are framing the argument, we want to touch on a few more “fringe” views.
- Financial conditions. The Chicago Fed’s National Financial Conditions Index continues to show “easy” financial conditions (I am not sure why negative numbers are easy financial conditions and vice versa, but that is how this index is calculated). The “easy” financial conditions could give the Fed the excuse to keep their current rate policy.
The arguments for lowering rates despite easy financial conditions would include:
- We live in a world where we have forward guidance, dot plots, etc. Back in the Greenspan era, market participants literally watched to see which hand he was using to carry his briefcase for signals. We have come a long way and maybe so much more is priced into markets ahead of time that the financial conditions’ indices need to be updated (or ignored). Credit is a key reason why financial conditions are so good. That is a good thing as banks (and private credit) are competing to lend. It is a good thing because so many companies (and individuals) used the era of ZIRP to lock in low yields, so they are better creditors. All that is somewhat inflationary, but I cannot help but wonder if lower rates might discourage lenders? Banks, in particular, are able to access cheap funds from their deposit base, so they benefit from higher fed funds when they lend. The potential that lower yields could be disinflationary is a subject we will revisit in a moment.
- To the extent that stock markets are impacting financial conditions, it seems like a good time to mention that the equal weighted indices, such as value and small caps (the Russell 2000 is down year-to-date), have not kept pace. While we can all question breadth or lack of breadth, the companies driving the growth are more about being at the cutting edge of a revolutionary new technology, than merely sopping up excess liquidity.
- Over time inflation gravitates towards the fed fund rate. This is a little “out there” and a decade or so ago it would have been anathema just to mention. But more and more people seem to be willing to at least discuss this possibility.
The theory is that changes to fed funds, at least initially, act as expected on inflation. When you cut rates, you get growth and inflation, and vice versa. But, as rates stabilize for extended periods, they can become a “magnet” for inflation. During the years of ZIRP following the financial crisis, rates were low, but inflation also remained stubbornly low. Some (including me) argued that if you make the hurdle rate equal to 0%, then people and companies will produce if they can earn just above 0%. Businesses that might otherwise not be viable will be able to survive. That keeps supply high and prices lower. It seemed to create a lot of “zombie” companies. From a “behavioral” standpoint, it makes a lot of sense. Once 0% is established as the cost of doing business, it doesn’t take much to stay in business. Conversely (and even less well tested) is that if you keep rates at 5%, you set a hurdle rate of 5%, forcing inflation. People and companies only stay in business if they can beat 5%. It is not uncommon in other fields to have initial reactions change over time. Basically almost any drug fits this analogy, so why should it not be plausible in economics?
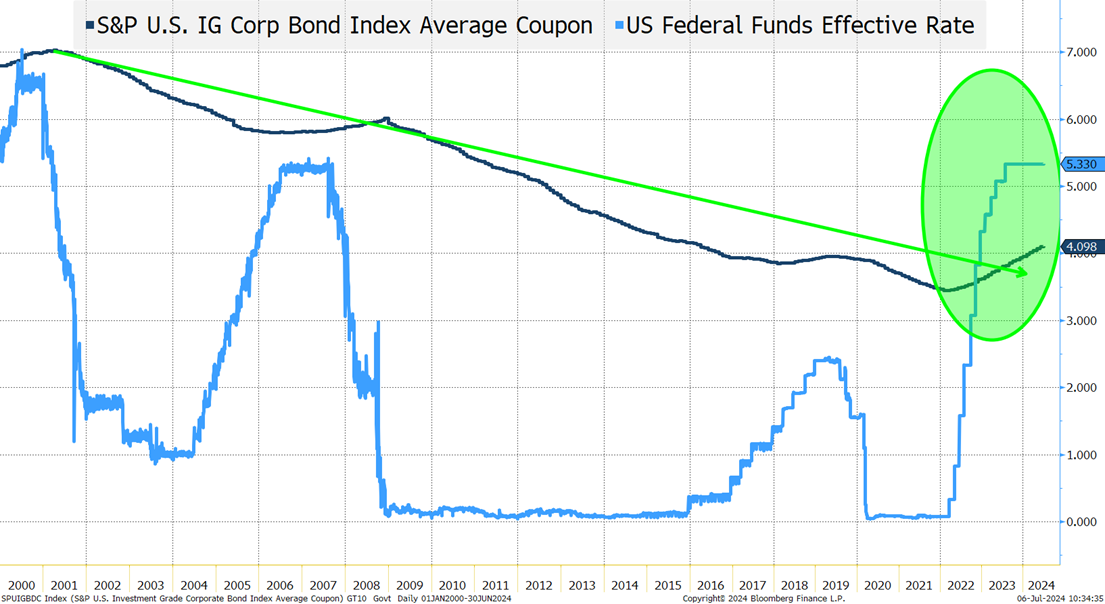
There have been some good reports about how Net Interest Expense for Corporate America is actually Net Interest Income right now. Yes, there are a few companies with massive amounts of cash relative to their debt, but this is the first extended period (in at least 25 years) where the average coupon in the corporate bond index is significantly lower than fed funds. If the Fed was to cut a few times, the income generated on cash would drop immediately, but the average coupon wouldn’t budge. Is it not possible that a rate cut would slow spending and be deflationary?
According to the SEC, money market funds had $6.4 trillion in AUM at the end of March. If you are not aware, Academy Securities offers several Academy Share Classes in the money market space – please contact your coverage officer about accessing these funds which are available on many large platforms. Using 5% and $6 trillion (to keep the math simple) that is $25 billion being pumped into the economy each and every month by money market funds alone. Maybe cutting that back would slow spending?
I am doubtful that the Fed will consider either of these arguments, but I suspect that if they get the inflation story wrong, and inflation reignites, it will have more to do with pumping too much money into the system via high yields, and forcing businesses to raise prices to maintain profits in an overly high interest rate environment, than for any other reason (except for Geopolitical Inflation, which is a persistent threat).
Inflation
We get CPI on Thursday morning, where Academy will get to perform its recurring role of doing a live breakdown on Yahoo Finance as the numbers hit the tape.
Yes, inflation remains too high, but it has been coming down. It is 100% clear to anyone that housing inflation, which has been propping up overall inflation, merely reflects stale data. That is one reason why the Fed looks to PCE more than to CPI.
In any given month, CPI might be doing anything, but generally, I’ve been very comfortable with the direction, and barring a commodity spike linked to some geopolitical action (that risk has been increasing), that trend should continue.
While simplistic (and the chart is admittedly elementary) the Covid “Bump” theory seems to be a great way to think about inflation and has been playing out in real-time.
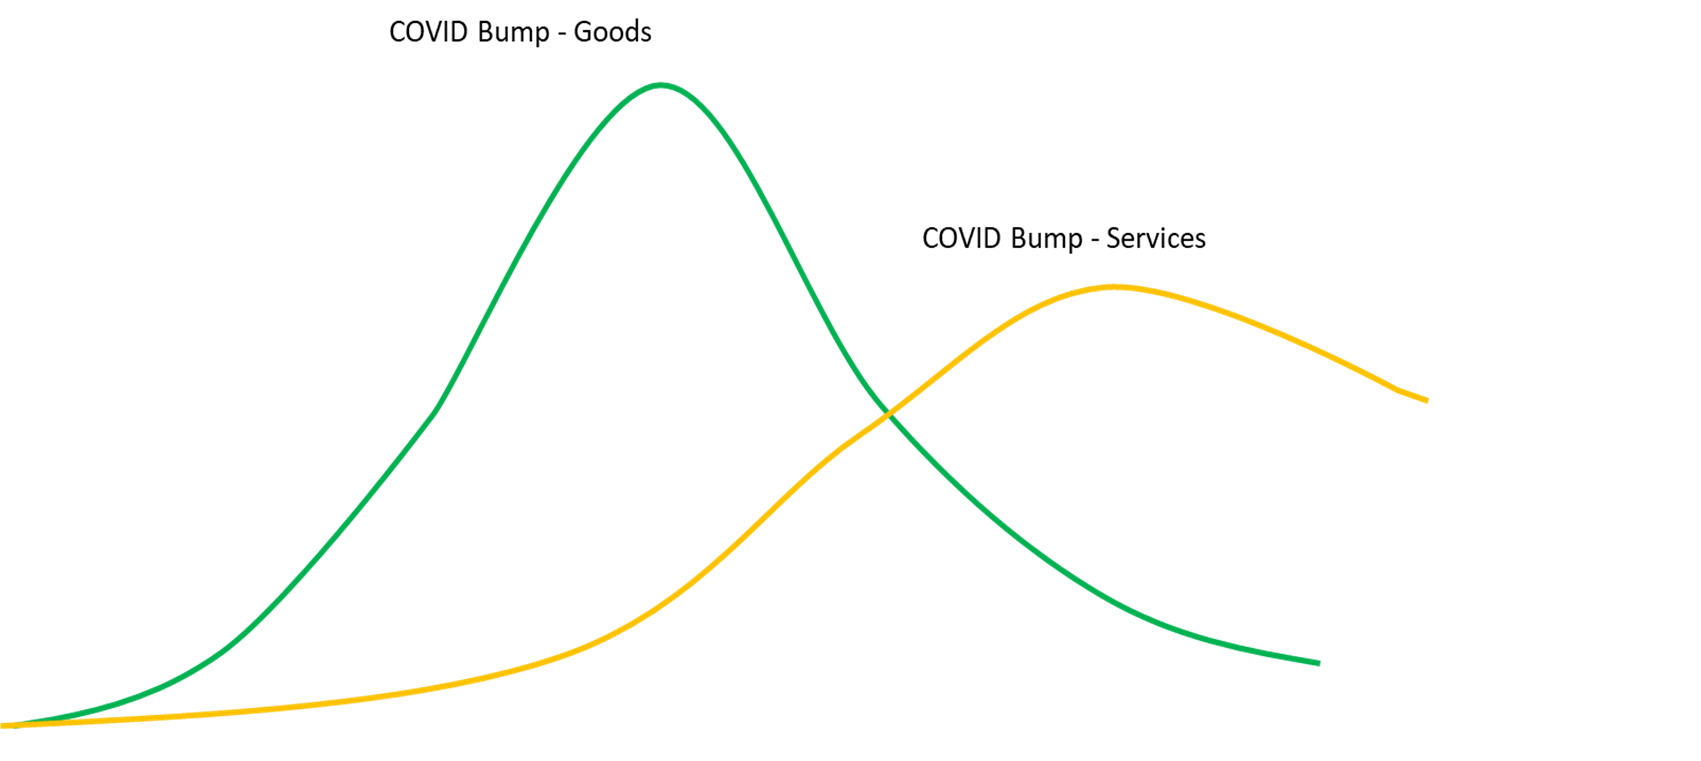
Goods had a much larger jump in inflation, and it started sooner as Americans were flush with cash and had immense built-up demand for goods, especially for those who were experiencing lifestyle changes enabled by work from home. The Manheim Used Vehicle index is a good one to watch on this.
Services took longer to start and were slower to ramp up. Not only were there rules, which varied by state, but individuals also differed on when they were comfortable doing things post-COVID. So, the services bump took longer to generate, and we continue to view Summer 2023 as the Summer of Vacations, representing peak services demand (relative to availability). As that normalizes, we should see less and less inflation pressure on the services side (as mentioned Friday, the ISM services employment index has been below 50 (and shrinking) for the last 5 months in a row).
Maybe this chart is far too simple? Possibly, but I think that it has captured the gist of inflation and is the basis for me remaining comfortable that the worst is behind us.
Bottom Line
We didn’t even touch on lag effects (even Powell seemed to admit that because of this they should start sooner rather than later).
Continue to look for 75 bps of cuts this year (with 2 or 3 cuts). I don’t see July as likely, though I think it would be prudent to start then.
Less inverted curves.
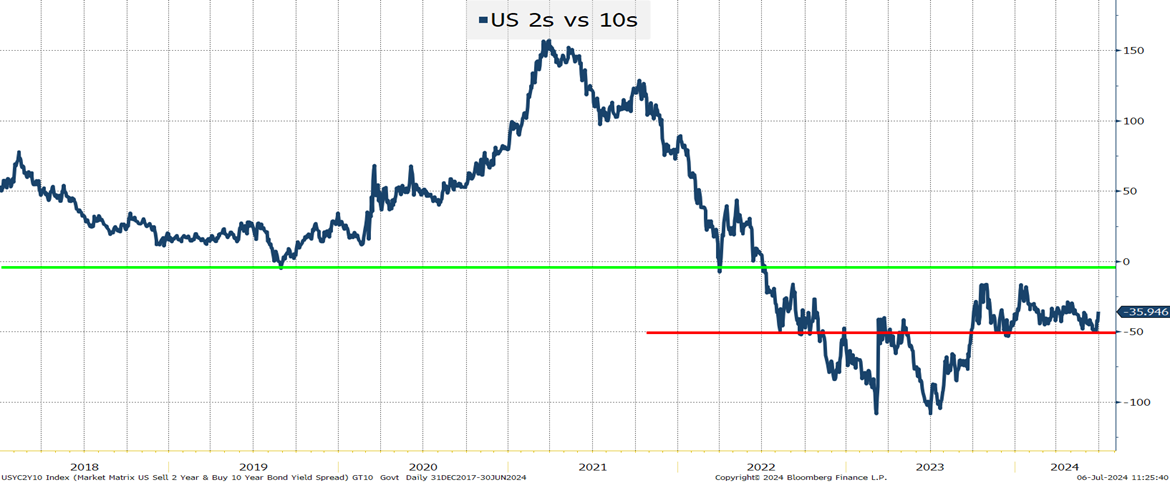
-50 seems to be a level of support. 0 would be the next target, which would be 33 bps from here.
“Less inversion” is why we think the 10s are still generally rangebound between 4.3% and 4.5% (with occasional breaks above and below).
Credit. All good. We should see new multi-year tights on spreads by the end of the summer.
Equities. Momentum and AI are ruling the day, and it is unclear what stops them. At least the CNN Fear & Greed Index climbed to Neutral. I’m really not sure that we’ve seen a situation where major indices are hitting new highs, and this index is mired in “Fear” territory.
Hope you have had a great 4th of July extra-long weekend (and enjoyed what seemed like 2 Fridays in one week), but now back to the grind!