How Tight Can Credit Spreads Go?
This is a piece that we’ve been meaning to get to for the past few weeks, but this weekend seemed like an ideal time:
- We completed our updated Rate Outlook this week, so it is natural to progress to credit. While Friday’s NFP data (where we are not the only ones pounding the table on the divergence between the two surveys – It Was the Best of Times, It Was the Worst of Times) likely took July off the table (and I don’t think September is feasible), it did little to alter our overall forecast for the coming months.
- Several friends, colleagues, and clients sent me a picture of “Sell IG” hats. If that wasn’t a sign that it was time to write more on credit, nothing is. For those of you not familiar with the history (and I find it difficult to believe it was almost 20 years ago), we made and sent out some IG 200 hats in early 2008. As a market maker in CDX indices at RBS, I’d done a report called “Roadmap to IG 200” when IG was around 100. It caught on and these hats were made. IG almost got to 200 as Bear Stearns started to collapse. There was a two-tiered market for a few days while Bear CDS were selling tighter than the rest of the street, if you had room/appetite for their name. But in any case, the hat comes up in conversation periodically (especially related to later in the year when it broke well through 200). For this report, I’m wishing I had some IG 20 hats!

Getting right to the point (which should be obvious with the IG 20 comment), I’m quite bullish credit, for a variety of reasons!
- The trend in credit right now is to take on more risk. Structured risk is increasing, which may be sowing the seeds of future problems, but will help credit for now.
- Private Credit. While lately there have been some articles and quotes questioning private credit, for now, this too will help credit markets.
- The composition of the bond market (especially high yield) has changed.
- Will U.S. deficit concerns help credit? This is a wildcard, but one that I think is already helping credit and will continue to do so.
- A “potpourri” of other reasons.
Maslow’s Hierarchy of a Credit Bubble
For me, if I’m going to talk about how much tighter credit can go, I might as well start with the tool I use to think about bubbles.
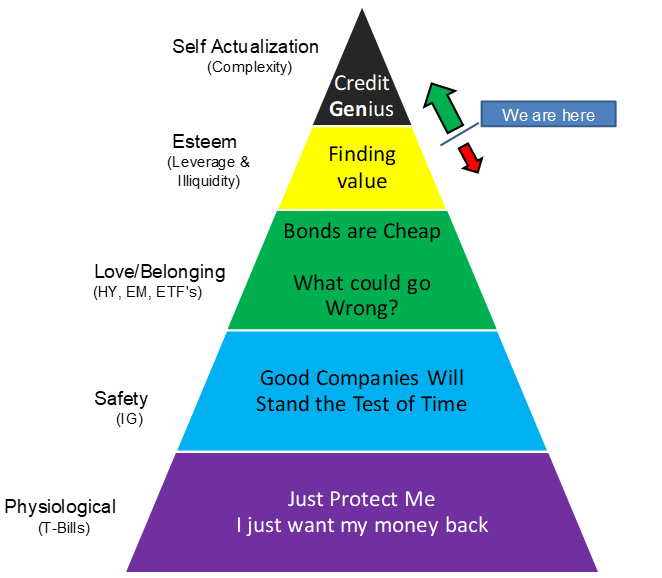
I find that credit investors conform quite nicely to this model. Investors move up and down the model as they either crave (need) risk or grow fearful and shed risk.
I see many signs that we are moving up the risk-taking spectrum. We are well beyond the Love/Belonging phase and well into Esteem. Which for me, in credit, means leverage and illiquidity. Private credit is quite literally the definition of illiquidity. I’m hearing of more ways to incorporate leverage into transactions and certainly more investors are being pulled into the structured space.
We are not yet in the “Credit Genius” phase where products like Leveraged Super Senior (LSS) and CPDO (Constant Proportion Default Obligations) are the name of the game. While the scars of the Great Financial Crisis and even the European Debt Crisis are still too fresh to propel us into this rarified space, we are heading in that direction.
This is where it is important to emphasize that direction of travel is important. So long as we are moving up the pyramid, spreads tighten. Each new innovation/investor into a space pushes spreads tighter in that space. It can become a self-reinforcing trade, as tighter spreads cause more “chasing,” pushing spreads tighter.
I think it was in June 2007 that spreads hit their tightest. CDX could be traded in billions in locked markets and the spread was below 30 (if memory serves correctly). LCDX was all the rage. The fact that the mortgage market was in some degree of disarray, and the fact that we were months away from some large banks (and broker dealers, because we had actual non-bank broker dealers back in 2007) having to cut their dividend didn’t stop us from reaching these new tights. The complexity is very dangerous when/if it starts to unwind, but it is a party on the way to being a “Credit Genius.”
The 5 Circles of Bond Investor Hell
This is a good segue into the “companion” chart of Maslow’s Hierarchy of a Credit Bubble. The 5 Circles of Bond Investor Hell.
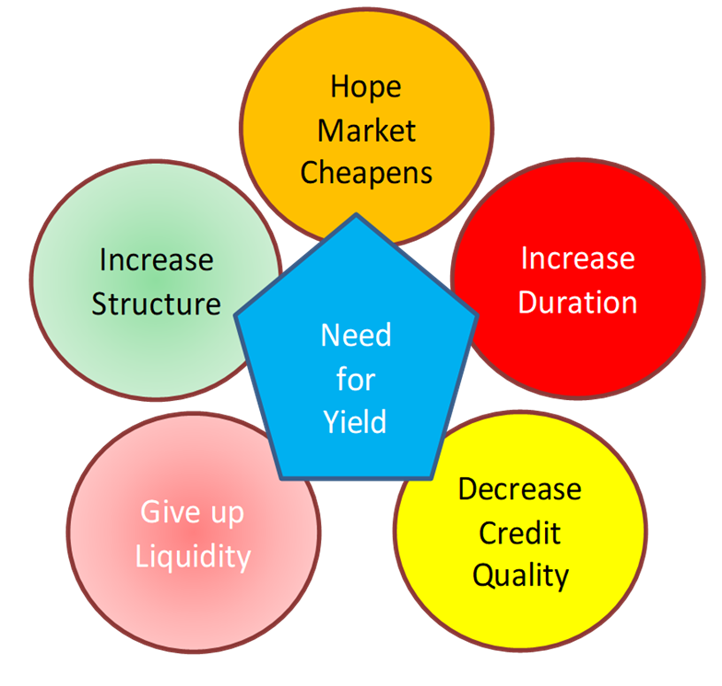
If you’ve traded bonds for any length of time, you’ve probably found yourself trapped in one or more of these circles. Basically, as credit spreads remain tight, there are only a few options investors have. You can “Hope the Market Cheapens” but most of us aren’t paid to sit on our hands, and after almost 6 months of spreads grinding tighter, it is difficult to stay in this circle. “Increasing Duration” doesn’t help much on the yield side, with curves remaining inverted, but it does help on credit. “Decreasing Credit Quality” is often a difficult one, as you may have mandates restricting this, but there comes a time when investors have to move in this direction to get yield. “Giving up Liquidity” seems to be the “go to” circle these days. It makes sense, especially as so many investors (like insurance companies) have tax/regulatory reasons that they cannot fully utilize liquidity in any case. “Increasing Structure” has always made the most sense to me (I’m a geek at heart) because it seems like with some additional work, you can capture spread from others who haven’t done the work. Adding some “modelling” capability can let you generate alpha, so it is a natural evolution. It is also an area where I think we could safely argue that rating agencies (technically the Nationally Recognized Statistical Rating Organizations – NRSROs) have required more and more subordination and structural advantages. The same rating now, as compared to pre-crisis, is likely far safer.
It is these “circles of hell” that feed the upward (and sometimes downward) movement within Maslow and I see no reason for it not to continue to push people more and more into risk, with structured risk and giving up liquidity being the main destinations.
Private Credit
Borrowing from Shakespeare, “I come not to praise Private Credit.” I am very much a fan of private credit. As of yet, I don’t see the industry as a whole pushing the boundaries too far. I do believe that most investors understand the liquidity constraints, and the default risks they are taking. I don’t see excessive leverage in the deals themselves or in how investors are accessing this market. But this isn’t the time or the place for me to go all “Mark Antony” on Private Credit, which I could do, as I like it. However, I would prefer to highlight why I think it will be important in the further tightening of overall credit spreads.
- Many credits that would have difficulty finding financing in other markets have moved to private credit. While some of these never would have been in the “public market,” which I’ll limit to high yield bonds or leveraged loans (especially those eligible for CLO inclusion), some still were. As a whole, as those borrowers have moved to private credit, the overall quality of the high yield bond market and leveraged loan market has improved. My assumption, and understanding from what I’ve seen, is that private credit best suited companies that had more difficulty accessing those markets due to credit concerns, so it makes sense that those companies that remained in the “public” markets had better overall credit profiles.
- Banks, which have once again adapted to regulatory changes, have cleaned up their balance sheets, etc., and are starting to lend again across the spectrum of credit. A pullback from some of these lenders helped enable the growth of private credit. As these banks come in to compete, we should see the cost of credit decrease for many firms. I envision this as mid-size loans, for example, which were maybe 12%, getting redone at 10%. That sort of spread and yield compression on the smaller and weaker credits will result in some element of spread compression for bigger and better credits.
- Pretend and extend. My strong view on private credit is that many lenders will work more closely with their borrowers (which is a good thing, despite me calling it “pretend and extend”). Many companies will find ways around problems and be given the time to grow out of them. For some (maybe even many) this will work. For those it doesn’t work for, the remnants will likely be of little value. So, my working assumption is that private credit will reduce and delay the default cycle, but any eventual defaults will have lower recoveries.
For now, private credit has been helpful for credit spreads, and with banks back competing, I see no reason for that trend not to continue. At some point private credit might be an issue, but it isn’t high on my list of potential risks (remember I tend to think Bubbles start with “Safe Assets”).
The Composition of the Bond Markets
I’ll be brief, as I’ve already touched on some of these issues, but it is important:
- The High Yield Bond market has changed more radically than any other market. There are fewer issuers, and they are generally much larger. That makes it more difficult for things to “slip through the cracks.” When only a handful of investors are in a deal, it is easy to be mispriced. When the market knows the credits well, it is more difficult to get something “wrong.” The overall transparency in the issuers is better than it was 2 decades ago, so anyone pulling up longer-term charts of spreads is comparing apples to oranges.
- Structured product ratings are more difficult to achieve. While maybe not universally true (there are so many segments of structured products), the ones that I know well (especially CLOs) have to “jump through more hoops” than they did before the crisis to get the same rating. For CLOs, which have never had a credit loss in an investment grade rated tranche (that I know of), you have taken something that was already “safe” and made it “safer.” There is opportunity for more tightening here as investors get increasingly comfortable (or just forced to look for yield). But again, much like for the HY market, comparing old spreads to new spreads does a disservice to you as you may be comparing apples to oranges.
- On the corporate side of things, the NRSROs were always slow to upgrade. They have likely become even more difficult to deal with (though I think the changes in attitude towards rating structured products shifted more than it did on the corporate front post-GFC). At the same time, while ratings might be marginally more difficult to achieve, corporations have grown more comfortable hanging out at a lower rating than they might have otherwise. The spread differential isn’t big enough to offset the operational issues required to achieve that higher rating. So yes, BBB companies make up more of the index than before, but so what? Maybe it was because I grew up in high yield where BB seemed like “money good” or maybe it is just quite simply that we see so few defaults, even within 5 years of being BBB, that I cannot get too worried about IG credit quality. For those of you who trade (or traded) the CDX IG index tranches, there was never a loss in even the 3% to 7% tranche for 5-year maturities, and I think that applied to 10-years as well (it has been a few years since I did the work, so I cannot confirm it, but the gist of the point remains the same).
Basically, for structured and high yield, I’m comfortable that long-term charts on spreads are misleading as the current markets are “safer” than they were historically, meaning that they can sustain (and deserve) better spreads.
The “Sovereign Ceiling”
Why can’t credit spreads compress further as the U.S. government does two things:
- Increases the amount of debt, seemingly endlessly.
- Talks more and more cavalierly about missing a payment.
Just look at “governance.” While many of the biggest issuers are “U.S.-based” they are, in reality, global enterprises. They operate across the globe in a myriad of jurisdictions. Many have cash. Most have leaders and boards that are well aware of their fiduciary responsibilities, including to bondholders (Year of the Debt Diet). Why not overweight corporate credit versus government debt?
We are all used to thinking about T+X for corporate bonds. Where X is the credit spread. But what makes up that credit spread? What is X really composed of?
- Credit Risk or Default Risk.
- Liquidity (though between portfolio trading, ETFs, etc., that liquidity premium should be lower).
- “Other” factors, like having to explain to someone why you own such and such a bond.
I would argue that as people get forced to look at the circles of bond investor hell, they might decide that corporate credit, even at today’s “tight” levels, has the potential to go much tighter, especially as some of the biggest borrowers stack up favorably versus even the “safest” of issuers (the U.S. government).
Potpourri
A few quick thoughts:
- At the start of the year, we were bullish on credit spreads at what was then “tight” levels heading into issuance, partly because the market seemed too negative and underweight. That seems to be the case again, just as issuance might slow, at least in IG.
- We’ve often argued that you are never paid enough on spread for the idiosyncratic risk of a company, but collectively, you are overpaid for the collective risk on a portfolio. With portfolio trading, ETFs, and the advent of credit futures, you could see the “portfolio” effect continue to push spreads tighter. There is never “free money” on Wall Street, but historically, credit spreads across a well-diversified portfolio seem to come close.
- While the “Sell IG” hats concern me, it might be a sign of frustration, and be enough to give us one more good push tighter this summer (and I can break out the IG 20 hat).
Bottom Line
I’m not sure I brought up a single geopolitical or economic argument in favor of tighter credit spreads, but I think, to the frustration of many, that we will see another leg tighter across the board in credit.
Back to the original question, “How Tight can Credit Spreads Go?” – I think we can get into the 30s on CDX IG, and corporate bond spreads will also get to the tightest levels since the GFC, which seems only fitting with stocks at all-time highs.