Monthly Tariff Revenue Charts
I like to use the Bloomberg UTYDDPCT Index (US Treasury Deposits Custom & Certain Excise Taxes -Daily Tariff Revenue). The data is daily, but the vast majority of the revenue is reported on a single day (usually the 22nd, 23rd, or 24th of the month).
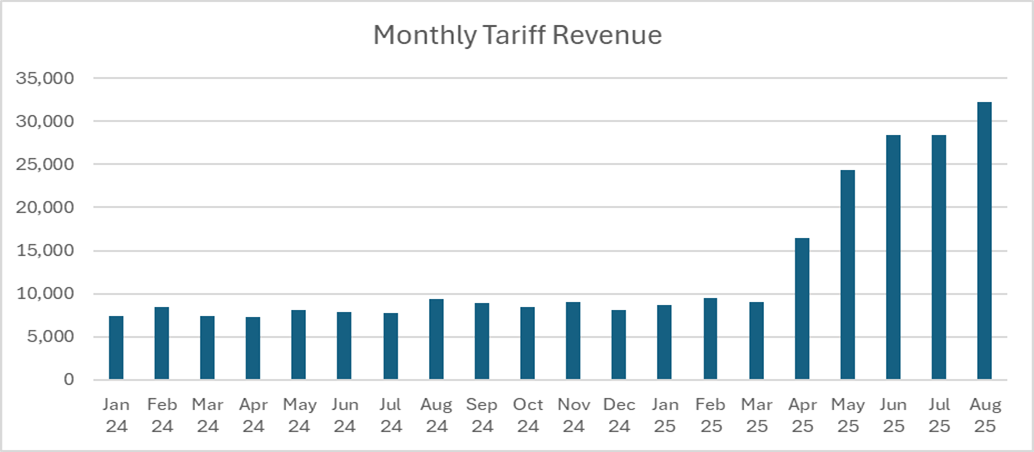
On August 22nd, the data shows $22.5 billion, bringing the total for the period since the last large data point (July 23rd) to $32.2 billion. I think that is close enough to “monthly” for purposes of this chart.
Using this calculation process, all of 2024 had $98 billion of tariff revenue.
As of August, the U.S. has collected $157 billion of tariff revenue this year. Clearly we are on pace to collect more than that for the full year (around $300 billion is possible – if companies ordered a lot of goods ahead of tariff increases, we would expect the monthly number to grow as new goods are imported at the current tariff rates, almost certainly higher than they were at the start of the year).
If no one thought $100 billion was inflationary in 2024, why would we expect big tariff-related inflation already with “only” $157 billion of tariffs?
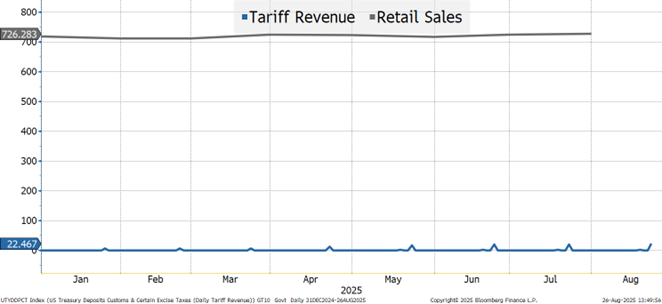
This chart is almost nonsensical (but that is the point). Who in their right mind would plot something that is about $700 billion a month (almost $8 trillion annually) against something that gets to a max of $30 billion during the same period?
So far, tariff revenue is a drop in the bucket compared to retail sales.
- Retail sales include sales of used goods (apparently) so maybe that overstates the importance relative to tariffs, because used goods won’t have tariffs.
- But retail sales only capture things purchased by retail. While some imported goods (on which tariffs were paid) make it to consumers rapidly, there are plenty of reasons why even goods that have been tariffed haven’t made their way to the consumer:
- Retailers will have inventory, so they may be selling “older” inventory that wasn’t tariffed.
- Far bigger, is that many things imported, on which tariffs were paid, are only “part” of something bigger.
- Commodities may take months to be processed into finished goods that get sold.
- Some items might never be sold to “retail.”
- Things may need to be combined into a bigger product or installed as part of a project before they make it to the end purchaser (like an HVAC system).
- Or maybe it is something used by a service provider, who hasn’t had to buy new inventory – like a hairdresser who has an inventory of shampoo – I’m told that is a real thing, but I have no personal experience with it. 😊
- The list goes on and on…
One thing which we will highlight, over and over, is that the extra revenue goes directly to reduce the amount needed to be borrowed. We are still borrowing (I believe at record pace), but that doesn’t change the fact that the particular benefit of tariffs is immediate.
I don’t think tariffs will be an inflation “shock.”
I do think that tariffs over time will put upward pressure on prices, first into goods and then into services as the cumulative effect of tariffs grows. We will eventually move into a “steady state” of tariffs, where importers and exporters have finalized deals and the importers start figuring out how to deal with any portion of the price increase that they couldn’t get the supplier to eat.
I probably won’t bother with this chart next month, as I’m sure many of you are tired of me repeating myself, but I do think these charts put the conversation about the impact of tariffs, so far, on the economy and inflation into a reasonable context!
Hope you are enjoying this last full week of Wall Street Summer!