Did VIX Really Hit 65 on Monday?
Without a doubt, the official VIX calculation reported a level of 65.73 on Monday at 8:34am ET. That level was posted and is now being used by many people to justify long positions in equities. The theory seems to be that we had an “epic” spike in volatility indicating panic, and that panic has since receded – hence creating a buying opportunity. Notice, that we chose to use the word volatility here, partly because many seem to use VIX and Vol interchangeably – which is not accurate.
In any case, normally we’d just leave this alone, but the fact that so many people are taking comfort in the “fact” (quotations used to indicate it isn’t really a fact) that we had a vol spike and it is over, makes me incredibly nervous. We will explain why.
Background on VIX
Let’s go back to September 2017, when the Wall Street Journal published Could Some VIX-Related Funds Go “Poof” in a Day? It was one of the most interesting articles I’ve worked on. We were quite alone in the view and the author received major pushback, particularly from the ETF providers. Their main argument boiled down to:
- VIX has never risen so much in a day, so it is impossible.
Our argument was quite simple:
- VIX had historically been a calculation and the products were based on VIX futures. The nature of turning something from an “observation” into a “tradeable product” introduces dynamics (like stop/loss on VIX itself) to the ecosystem, rendering historical data (on when it was merely an observation) less relevant.
- The exchange traded products (if memory serves, I think one was an ETF and one was an ETN) created the need to buy or sell contracts between 4 and 4:15pm (I think that was the window) to rebalance their leverage. While traders might not discern whether there were inflows or outflows that day (which would affect the end of day need to buy or sell), it was easy to calculate the amount needed to buy or sell based on the daily change if the share count remained the same. That meant that if we had a large move, there would be large demand (far greater than normal volumes available to trade) that would occur in that window – which traders could take advantage of.
- The VIX calculation itself is quite easy to manipulate and people trying to “bust the VIX ETPs” could use that to help their efforts along with buying the futures themselves.
On March 4th 2018 the WSJ published A VIX-Related Fund Did Go “Poof’.
We got that right, partly because we had spent a lot of time on VIX calculations as TF Market Advisors had built a series of VIX calculations for fixed income (the F in TF did the heavy lifting). We had built out HYG and JNK “vix” calculations as an additional tool to monitor fixed income markets and ETFs.
We used the CBOE VIX – Volatility Index Methodology as our guide. It is not for the faint of heart. What struck us at the time was:
- The calculation uses the entire option chain – including very illiquid options, which seemed odd to us as it allows some largely irrelevant options to skew the entire VIX calculation.
- Increases in the bid/offer spread impacted the calculation. It would be one thing to use traded prices, but since most of the deep out of the money contracts (lottery tickets) rarely trade, the calculation can use a midpoint (I think it is more complex than that, but think that is close enough for the argument we are making). So, a deep out of the money option, quoted 1 cent on the bid side and 1 cent of the offer side and never traded, is counted. If, on a volatile day, the algos making the option prices (and most of the out of the money options are quoted by algos rather than humans for small size), decide to widen bid offer spread and now make the market 1 cent bid vs 5 cents offered, they just impacted the VIX significantly. PAUSE. It doesn’t take a traded value to move VIX. The seemingly “innocuous” effort for algos to avoid getting picked off (wider bid/offer spreads) on something that rarely trades, moves VIX. This is a big part of my issue with the 65 print on Monday morning.
I spent some time with Robert E. Whaley, the creator of VIX. He was generous with his time, in part because he was (and is) a Professor at Vanderbilt University, which I also attended. It was very helpful and one factoid that I enjoyed very much was that the original name was going to be REW (his initials), but another exchange owned that ticker so they went with VIX (would a rose by another name smell as sweet?).
There is one final piece to the VIX 65 puzzle that we have discussed here in the past. VIX only includes options expiring between 23 and 37 days. So, as the market has gravitated to 0DTE options, a much smaller percentage of total option trades involves trades that impact VIX. While daily and weekly options might be fun to punt around (they clearly are dominating in terms of flows), it left us concerned that when real hedging needs occur, and traders want longer dated options, the rush from zero day to vix eligible options could cause distortions.
That is the background on much of the thought process behind questioning any decision based on VIX posting a 65 level.
Fear, but No Panic
There was fear, we concede that, but we will argue (and hopefully demonstrate) there was no panic.
Calculation versus Reality
Traded price, in size, is always the best mark to market. Observations, calculations, etc., no matter how sophisticated, are rarely better (or more useful) than actual live traded prices. Look at elections to see how many people now prefer to focus on betting markets rather than polls.
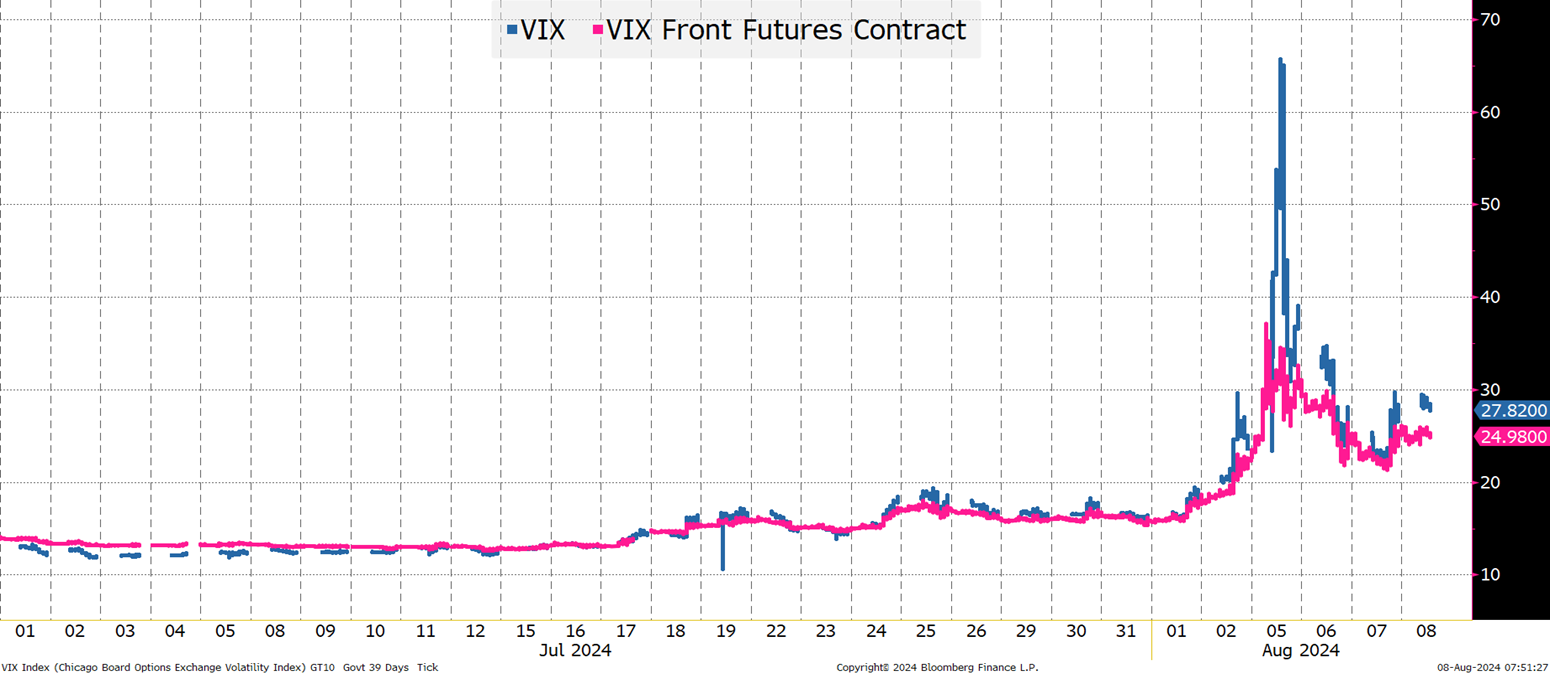
Here we examine the front VIX futures contract versus the VIX calculation. What we see is that most of the time, the front futures contract follows the VIX calculation reasonably closely. The deviations are likely easily explained (future mechanics, etc.) and are pretty negligible in the grand scheme of things.
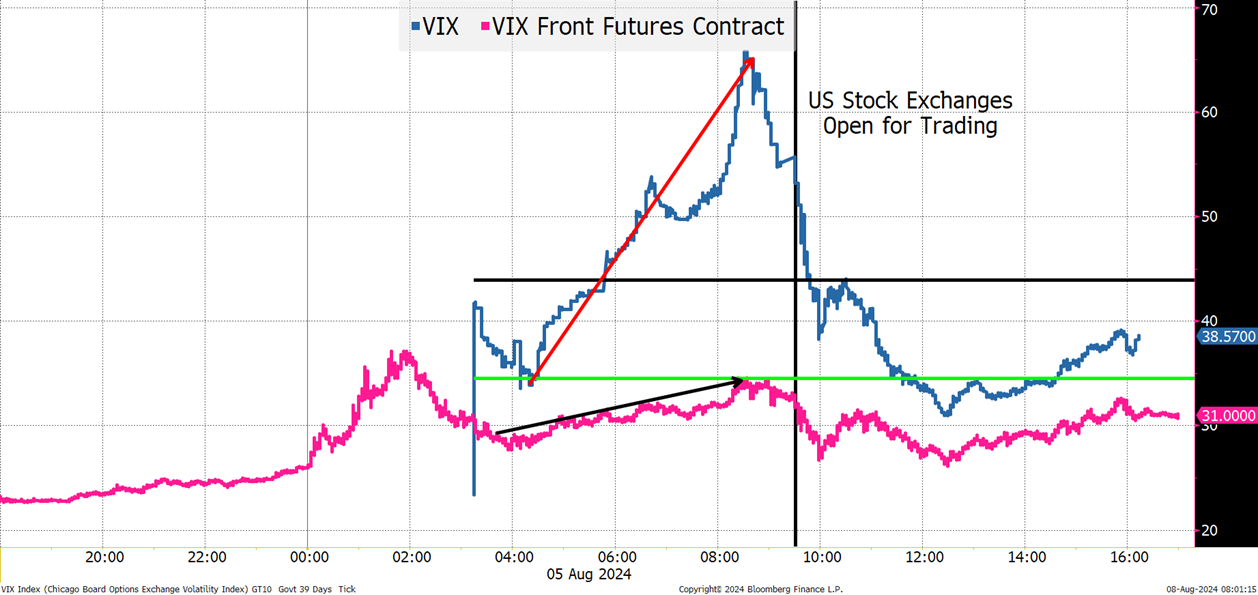
The VIX calculation hit a high around 8:35am ET. It went higher in a straight line from 4am until 8:30am. The VIX futures contract, where people risk actual money, barely budged during that period.
VIX futures hit a local high around that same time, but it was only 34.2, up from 21.8 at Friday’s close. So, I’m supposed to trust a calculation rather than a traded price?
Let’s go further.
As the U.S. stock market opened, we saw the VIX calculation drop rapidly. The gap between traded volatility (VIX futures) and some calculated amount dissipated rapidly!
The S&P futures did hit their low at 8:30am, at a level of 5,120. That market recovered as we neared the open and was at 5,182 just after 10am. So maybe, the fear in the markets subsided as we didn’t see “panic” selling at the open, but the moves in the VIX futures seemed much more in line with what was occurring in the stock market rather than the VIX calculation.
Many of the people we communicate with are avid options traders. They were all complaining about abysmal liquidity in options that morning!
As discussed above, wider bid/offer spreads affect the calculation. Maybe relying on the VIX calculation based on options markets before the U.S. cash markets officially open for the week is an issue? Pre-open (especially on Sunday night/Monday morning) and post-close markets can be thin and incredibly volatile (SMCI moved from roughly $620 to $727 to $550 in less than an hour after it released earnings Tuesday).
I am highly skeptical that the options prices going into the calculations for VIX were even remotely accurate (away from the biggest, most active contracts) and that is why VIX spiked to seemingly incredible levels (because they were incredible – in the “not real” sense) while VIX futures seemed to behave much more like the market felt.
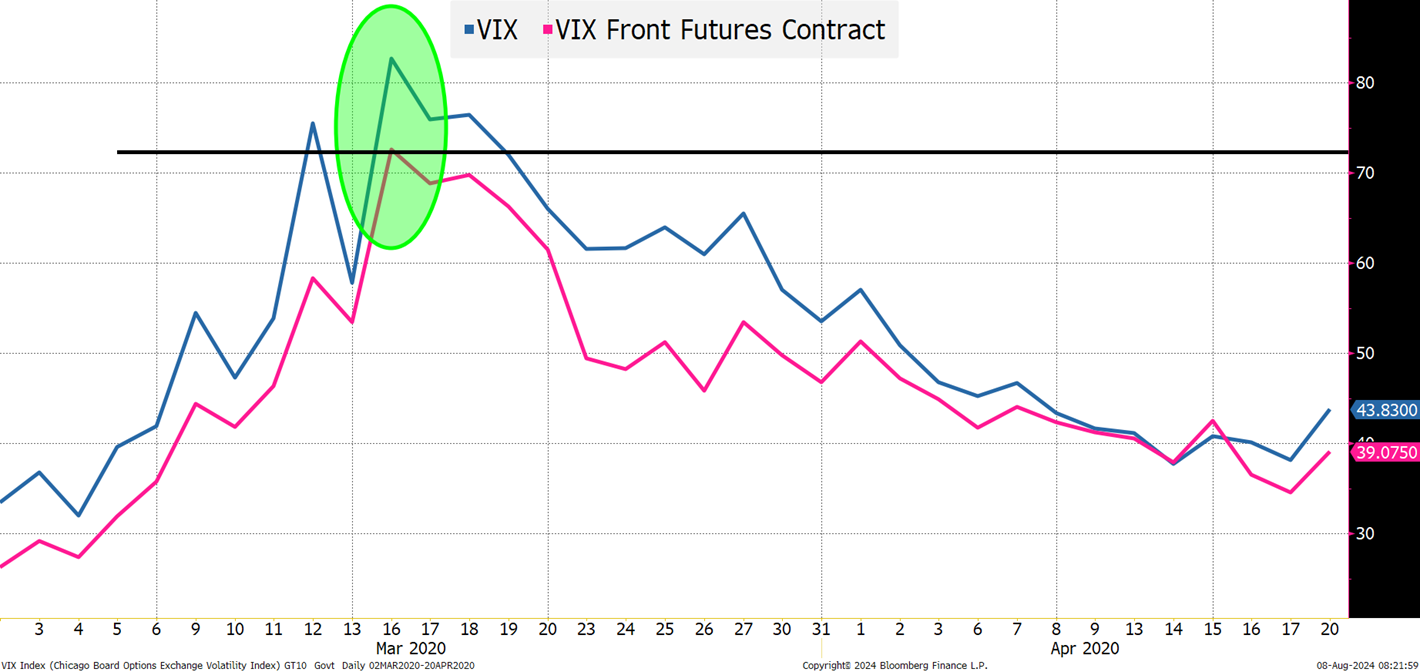
Apparently, I don’t have access to tick data on the futures contract prior to 2020. But back at the COVID PEAK PANIC, the difference between VIX at 82 and VIX futures at 73 seems pretty reasonable. Maybe something will show up if I’m able to get tick data, but I think we can argue that VIX and VIX futures were much more in line back during COVID, both showing real fear. The fear was extended over several days as well! They both spent a number of days at high levels. Also, fwiw, they spiked on March 12th, receded dramatically on the 13th, “re-spiked” on the 16th, and didn’t get back to levels seen on the 13th until the 23rd.
The behavior “this time” was different and I do not believe that is a “good” thing!
ETF Flows – Greed, Not Panic
QQQ, a large Nasdaq 100 ETF, had inflows on Monday (and has more shares outstanding than it did last Thursday). SPY (S&P 500) had solid inflows on Monday. TQQQ, a triple leveraged long Nasdaq 100 had small outflows on Monday (was above where it started the month) and has had steady inflows since. SQQQ (inverse 3x Nasdaq 100 ETF) had outflows Monday (profit taking and people getting less short). ARKK, my proxy for “disruption” had inflows on Monday (it has since given up those flows). Finally, NVDL, the leveraged ETF based on a single stock, had inflows on Monday, again on Tuesday, and even more yesterday.
Show me the panic?
Bottom Line
There was no panic on Monday (nor should there have been).
As a current bear and a contrarian, it would have been nice to see panic.
People are saying there was panic and are buying the market based on that.
That scares the heck out of me! I’m going to stick with my argument that VIX futures and ETF flows tell the real story – some fear, and a decent amount of greed.
We are always looking for positioning to be offside and for narratives that are widely accepted to be fraught with issues. I think the “complacency” that the worst is behind us, is dangerous and is setting us up not only to test/re-test 200-day moving averages (likely triggered by auctions, earnings, and/or economic data).
Back at “peak COVID fear” we were bullish. That was real fear. Real panic. It was underestimating what the Fed could do (and they did a lot, including agreeing to buy new issues and ETFs despite not having the mechanics even in place). Discounts to NAV on ETFs were all over the place. Fear was palpable.
Other than pointing to what is largely a bogus VIX calculation (based on time and knowledge of how it is calculated) where was the fear?
Despite the BOJ trying to slow the alleged yen carry unwind (by saying they wouldn’t hike while markets were volatile) the Nasdaq 100 closed lower yesterday than it did on Monday.
In my opinion, with no de-risking, and a bunch of new longs based on a VIX thesis that I think doesn’t reflect reality, we are still overbought, overleveraged, and prone to more selling given the right trigger. I’m less concerned about the “yen carry trade” than the plain and simple leverage that is in the system.
“Garbage In, Garbage Out” is a constant theme in T-Reports, and I think the VIX 65 print is a garbage piece of data, and use it in your investing at your own peril.
On one positive note, it seems unlikely that we fade into the close today, because even my mother has noticed that trend. 😊
Even as I’m back to full bearish (we too enjoyed the Monday afternoon/Tuesday morning bounce) we are deathly afraid of limited liquidity, in both directions! Small and nimble is appropriate.