A “New” Useful Chart
Around the World With Academy Securities
In case you missed the Around the World yesterday, our Geopolitical Intelligence Group weighs in on the Middle East, Russia/Ukraine, and China.
A “New” Useful Chart
Occasionally some chart hits our radar screen that we haven’t paid much attention to in the past (or didn’t even know it existed). Remember when we were all waiting for the Federal Reserve’s Bank Credit Officer Report (or something like that?).
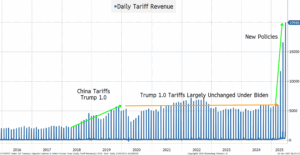
This is part of a dataset published by the Treasury Department (Daily Treasury Statement).
There are a few things that I don’t understand about the dataset. We will highlight them, but it probably doesn’t make much of a difference for the conclusions we reach:
- Given the title of the chart and how others are using the data, it seems reasonable that this is a decent “real-time” estimate of tariffs.
- The big number gets reported around once a month (seems to come in between the 22nd and 25th of every month). Presumably, this is some “aggregate” reporting. Tariff revenue comes in daily, but gets reported periodically? That seems likely, and we will learn more about this data set in the coming days.
What Does the Data Tell Us?
There seems to be a few things that we can learn from this:
- An extra $15 billion of revenue for the Treasury Department in the past month! The average had been around $6 billion for years, and it shot to $12 billion in April, $17 billion in May, and $20 billion in June (based on the day that the numbers increased the most). If you examine the smaller daily reported tariffs, we went from a run rate of $3 billion to $8.5 billion in the past month. That indicates that there was $20 billion MORE tariff revenue in the past month than the previous run rate.
- This should help the deficit situation. Presumably (assuming another extension of the pause), we should start getting a “stable” run rate later this summer. However, it is difficult at this stage to ascertain how much trade was pulled forward, then delayed, then pulled forward again, as tariff policy was released and amended. Still bullish on duration here.
- $42 billion of additional tariffs in the past 3 months helps the deficit, but what does it do for inflation? Or, maybe more accurately, what does this tell us about why tariffs aren’t showing up in the data?
- In a $30 trillion economy, $0.04 trillion of tariffs is a blip on the radar screen. Over time, the total amount of tariffs will grow to be a more important number, but at the moment, it shouldn’t be surprising that we are not seeing tariff-driven inflation.
- The tariffs are paid at the time the goods come into the country and are picked up by the importer (my current understanding). Even if 100% of the tariff was going to be passed on to the consumer (it won’t be), it will take time for prices to increase, and consumers to face those prices. Remember, while many of the things being imported are finished goods (which still need to be sent to stores, etc.), some are unfinished goods which need further work or installation, etc.
As this number grows over time, especially if the monthly number continues to grow, we could start to see more of the inflation pressures hit, but we continue to argue at the current “pause” levels, the inflation pressure is manageable, and will leak into prices over time (measured in months or quarters, not weeks).
Tariff Mitigation Strategies
This has become a “fun” part of our daily conversation. From simple things that seem completely in the spirit of the tariff/trade wars (getting goods approved as USMCA compliant, therefore not being tariffed at new, higher rates), to more complex shifting of costs, country of origination etc., that go against the “spirit” of the rules, but can work.
We have always discussed what percentage of tariffs will be absorbed by the exporter (lower profit margins), the importer (lower profit margins), and the consumer (higher prices), but increasingly, tariff mitigation strategies may play a crucial role in absorbing the tariffs.
Bottom Line
Very good for the deficit, which should continue to help bond yields (liking 4.1% on 10s in the coming weeks).
We can also see why tariffs don’t seem to be impacting data yet, largely because the increased levels are new and still small relative to the size of the economy. There are risks to the tariff strategy (though in the “manageable” range if we keep it around here), and those risks to the economy will start showing up in the data. They haven’t yet, not because they are non-existent, but because they are so small, and all of that could change with some deals, reprieves, or even (hopefully not) another round of aggressively ramping them up.
At the very least, hopefully this “new” chart gives you something to think about!